Kwant
Quant intelligence over MCP: backtest, signals, screens, scores & portfolios for US & TSX stocks.
Connect it
Settings → Connectors → Add custom connector
URL: https://kwant.sh/mcpSettings → Apps & Connectors → Advanced → Developer mode
Create connector with URL: https://kwant.sh/mcp{
"mcpServers": {
"kwant": {
"url": "https://kwant.sh/mcp"
}
}
}claude mcp add --transport http kwant https://kwant.sh/mcp{
"servers": {
"kwant": {
"type": "http",
"url": "https://kwant.sh/mcp"
}
}
}16 tools, pulled live
get_price_historyGet historical OHLCV price bars for a ticker. US symbols are bare (AAPL, MSFT); TSX symbols use the Yahoo .TO form (RY.TO) or the TSX:RY form. interval is one of 1m,5m,15m,30m,1h,1d,1wk,1mo (default 1d); range is one of 5d,1mo,3mo,6mo,1y,2y,5y,max (default 1y). Returns an envelope whose values contains interval, range, currency, count, and bars (records with an ISO timestamp plus open, high, low,
get_quoteGet the latest available quote for a ticker. US symbols are bare (AAPL); TSX symbols use the Yahoo .TO form (RY.TO) or the TSX:RY form. Returns an envelope whose values holds the quote fields (price, currency, previous_close, change, change_percent, volume, market_state, asof as an ISO string). (paid: $0.0050/call)
get_fundamentalsGet fundamental data for a ticker (profile + key ratios). US symbols are bare (AAPL); TSX symbols use the Yahoo .TO form (RY.TO) or the TSX:RY form. Returns an envelope whose values holds available fundamentals: name, exchange, currency, sector, industry, market_cap, pe_ratio, forward_pe, eps, dividend_yield, beta, fifty_two_week_high, fifty_two_week_low, asof. Fields not covered by the provider a
compute_indicatorCompute a technical indicator (RSI, MACD, SMA, EMA, BBANDS, ATR, ADX, STOCH) over a ticker's price history. Returns the warmup-aligned series plus the latest values and a one-line summary. Tune the window with `length` (SMA/EMA/RSI/ATR/ADX/BBANDS), `fast`/`slow`/`signal` (MACD), `std` (BBANDS), or `k`/`d`/`smooth_k` (STOCH) â pass them either as top-level fields OR nested under `params`; both wo
detect_signalsDetect classic technical-analysis signals on a ticker's price history. Each requested signal is evaluated and reported as triggered/not-triggered with a date and human-readable detail under signal_summary. Signals (omit `signals` to check all six): golden_cross = SMA(50) crosses above SMA(200) within `lookback`; death_cross = SMA(50) crosses below SMA(200); macd_cross = MACD line crosses above its
compute_statsCompute quantitative statistics (volatility, sharpe, max_drawdown, returns, beta, correlation) over a ticker's daily price history. Omit `metrics` to default to volatility/sharpe/max_drawdown/returns. `beta` and `correlation` require a `benchmark` ticker; `risk_free_rate` is used only by the Sharpe ratio. (paid: $0.0050/call)
compare_tickersRank two or more tickers against each other by a single metric (total_return, volatility, sharpe, max_drawdown, last_price). Symbols that cannot be resolved (or lack enough history) are skipped and noted in `warnings` rather than failing the call. Returns a ranked list of {ticker, value, rank, currency} (rank 1 = best). (paid: $0.0050/call)
screenScreen a stock universe for tickers matching quantitative filters (logical AND). Fields: price, rsi, sma_50, sma_200, volatility, sharpe, max_drawdown, total_return, dollar_volume, garman_klass_vol. Ops: lt, lte, gt, gte. (paid: $0.0100/call)
backtestBacktest a simple long-only technical strategy on daily price history. Strategies: sma_cross (golden/death cross of SMA 50/200), rsi_reversion (enter RSI<30, exit RSI>70), macd_cross (MACD line vs signal). No-lookahead: signals act on the next bar's close. Returns trades + performance metrics. (paid: $0.0100/call)
screen_with_scoresRank a stock universe by a continuous cross-sectional signal score (rank 1 = highest z-score). Signals: jt_momentum, mean_reversion, rsi_filtered_momentum, trend_quality. Scores are relative to the scanned set. (paid: $0.0100/call)
compute_universe_scoresScore and rank a universe of tickers by a cross-sectional signal. Resolves either a named universe (SP500, TSX) or an explicit tickers override, bulk-fetches daily price history over range, computes a raw per-ticker score for the chosen signal, then converts those raw scores into cross-sectional z-scores and ranks them across the universe (rank 1 = highest z-score). Signals (JegadeeshâTitman mom
build_monthly_universeRank a universe of tickers by monthly dollar volume with trailing returns. Resolves either a named universe (SP500, TSX) or an explicit tickers override, bulk-fetches daily OHLCV over range, resamples each to monthly bars (open=first, high=max, low=min, close=last, volume=sum), and per ticker computes trailing returns over 1/3/6/12 periods plus the latest monthly dollar volume (close * volume). Ti
construct_portfolioTurn a {ticker: score} mapping into long-only portfolio weights. Selects names and assigns non-negative weights that sum to 1.0 using the chosen method: top_n_weighted (weight by clipped score), equal_weight, risk_parity (inverse-volatility), concentrated_vol (highest-vol from a top-score pool), or sharpe_optimized (max-Sharpe long-only). The last three fetch daily history over range (5d,1mo,3mo,6
run_portfolio_backtestBacktest a rebalanced, multi-ticker, long-only quant portfolio. Fetches daily history for every ticker over range, then runs a walk-forward simulation: at each period-end rebalance the chosen signal (jt_momentum, mean_reversion, rsi_filtered_momentum, trend_quality) scores each name using only data up to that date, and method turns those scores into long-only weights. Returns gross and net (after
compute_portfolio_statsCompute portfolio-level statistics for a weighted basket of tickers. Given a {ticker: weight} mapping, fetches each ticker's daily history over range and returns the portfolio-level (not per-ticker) volatility, sharpe, max_drawdown and total_return of the weighted basket. weights need NOT sum to 1 (normalized internally). Tickers that cannot be fetched are dropped, a note is added to warnings, and
compute_correlation_matrixCompute the pairwise return-correlation matrix for a list of tickers. Fetches each ticker's daily history over range, converts it to daily returns, and computes the pairwise Pearson correlation (aligned on shared dates). Requires at least two tickers; tickers that cannot be fetched are dropped and noted in warnings (at least two must survive). Returns the standard envelope; values holds range, the
Alternatives in Finance & Payments
Compare →STStripeOfficialA
MCP server integrating with Stripe - tools for customers, products, payments, and more.
DEDexPaprikaA
DEX and on-chain data: liquidity pools, token prices, swaps, and trading volume.
GPGSA Per DiemA
GSA Per Diem access readiness, lodging, and meals and incidental expense rates. 7 tools.
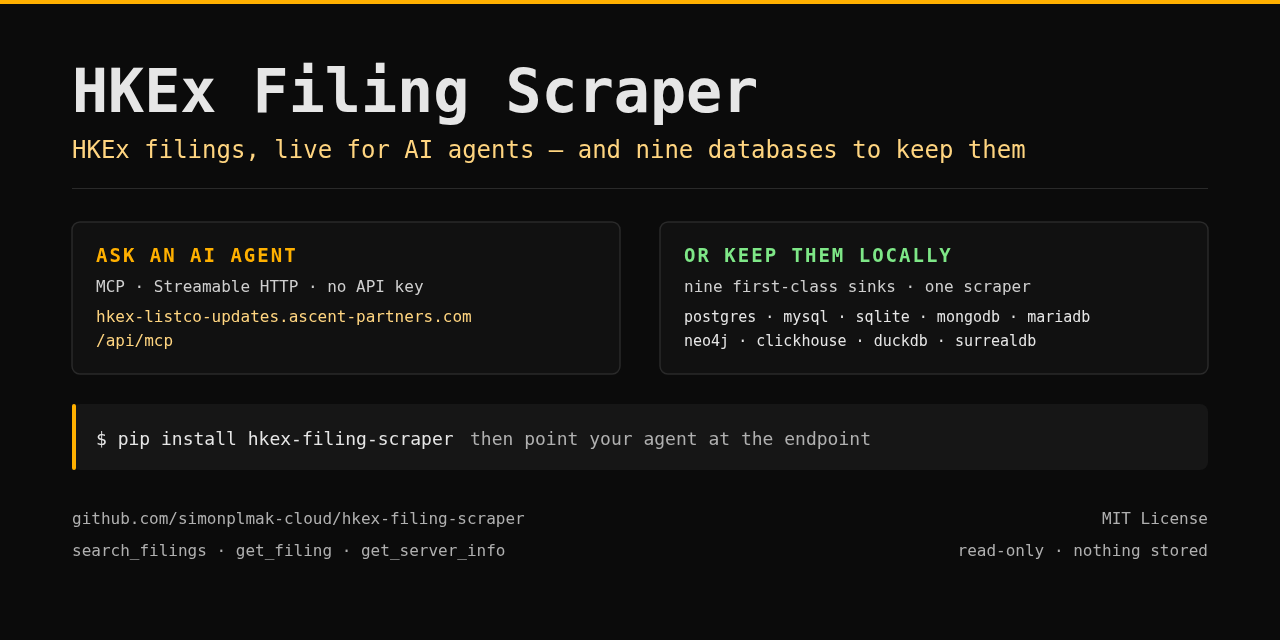 HKEx FilingsA
Live HKEx (Hong Kong Stock Exchange) regulatory filings for AI agents.
 PayRamA
Install, configure, operate and integrate self-hosted PayRam crypto payment gateways.
 Beancount.ioA
Query, edit, and reconcile a hosted Beancount ledger: BQL, reports, files, and bank imports.